Lab 6.3: Visualizations in ROS with RViz
Visualizations of different sensor data and hidden robot states can be extremely helpful in debugging robot software. RViz is a visualization tool in ROS that allows creating visualizations from published messages of certain types.
Objectives
At the end of this self-learning lab, you should be able to:
- Use rviz to visualize published messages.
- Use m2_fake_robot to perform robot simulation.
References
The contents of this lab were partly taken from:
Getting started with RViz
Check out the RViz User Guide to see everything you can do with RViz. Let's try a few of its functionalities.
Open a new terminal and run RViz:
roscore
rviz
An empty RViz window should appear.
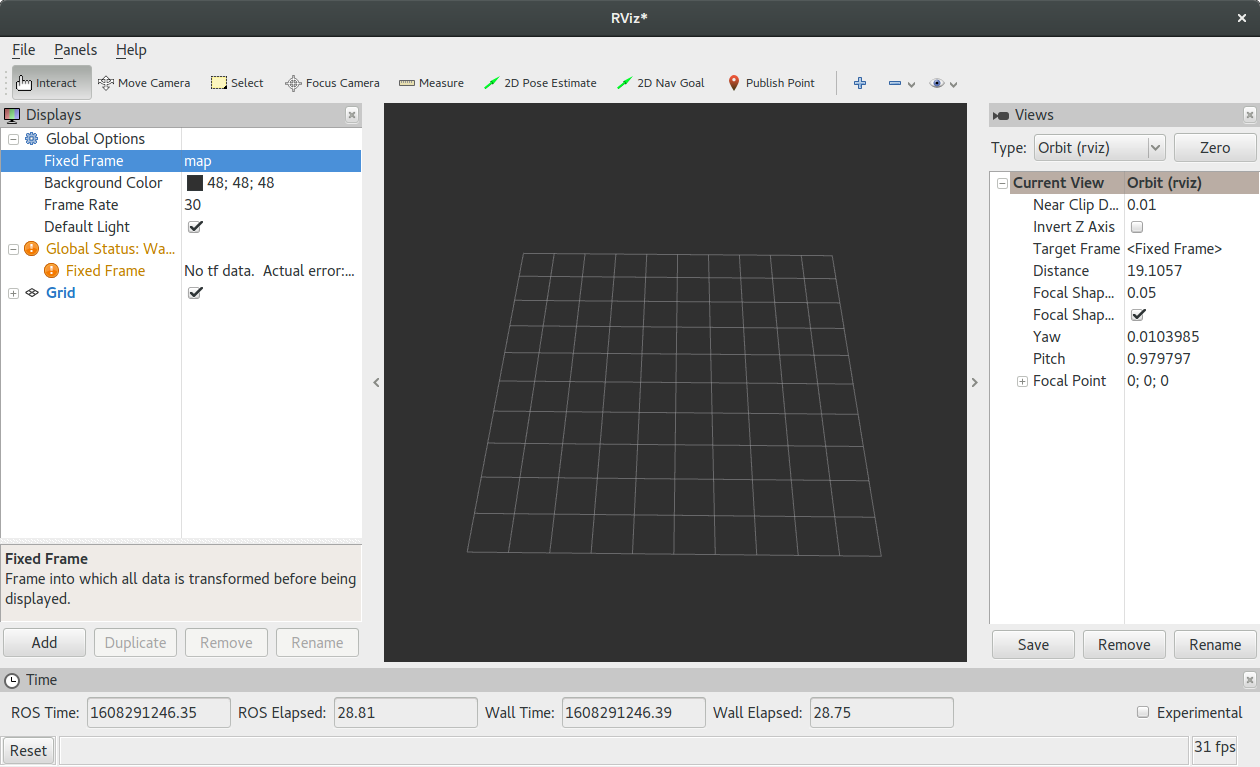
At this point you should see a "Displays" subwindow on the left that includes only the "Global Options," "Global Status," and a "Grid" display.
The dark gray subwindow in the middle is the 3D display.
Different visualizations can be aggregated on the 3D display, as long as they have a common or linked frame of reference. You can ignore the rest of the RViz window for now.
In this lab we will visualize things that are anchored to the map so you should switch the "Fixed Frame" in global options map.
What is a frame?
There can be multiple coordinate frames existing inside ROS at the same time. When we say that an object is located at (x, y, z) = (...), actually these coordinates are relative to some origin (0, 0, 0) in space.
There can be multiple coordinate frames, for example the map frame where objects are located relative to the game field, and the chassis_odom frame where objects are located relative to the robot.
We will see a more concrete example later.
Adding Elements to RViz
Next, you will add different visualization elements, called "Displays".
Visualization elements come from topics. So let's generate some visualization messages of the game field from m2_fake_robot.
Clone the m2_fake_robot package if you havent:
cd ~/catkin_ws/src
git clone https://github.com/m2robocon/m2_fake_robot.git
cd ~/catkin_ws
catkin_make
Run the render_map.py node:
rosrun m2_fake_robot render_map.py
Click on the "Add" button and explore the list of different display types offered in the pop-up.
Bug
Note: If the display panel does not update or react to clicks, you may need to resize the RViz window to have it re-render the UI. This is a known issue.
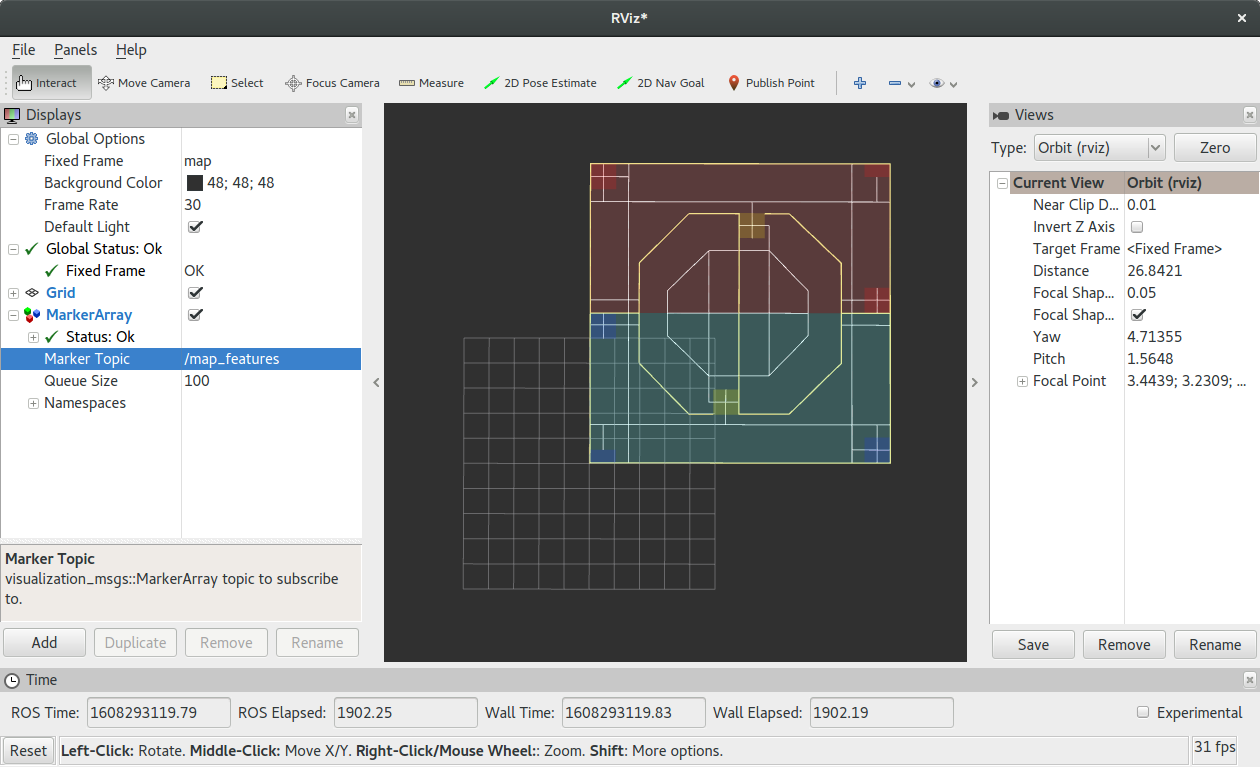
Find "MarkerArray" and double click it. A new item should appear in the "Displays" list.
Click the "+" button next to "MarkerArray", then change the marker topic to /map_features.
A visualization of the game field should appear in the 3D display. You can remove the "Grid" display for better clarity.
Warning
Please note that RViz is not a simulation of the robot, but rather it is a visualization of the robot that is currently simulated in m2_fake_robot.
Tip
You may notice that the corner of the game field is located in the center of the grid. This is because the center of the grid is the origin of the map frame, and the game field markers were published relative to the map frame.
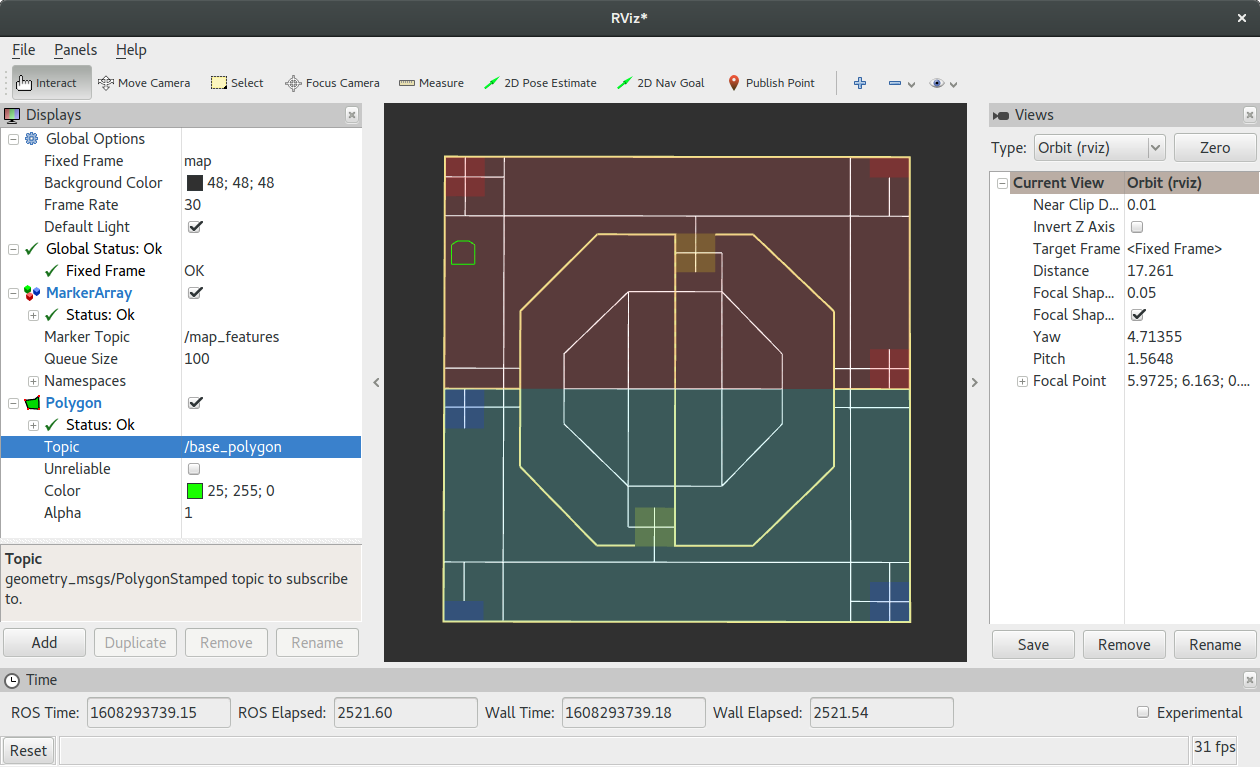
Now, let's render the chassis of the robot as well. Run the render_chassis.py node:
rosrun m2_fake_robot render_chassis.py
Add the simulated chassis to rviz by adding a display of the "Polygon" type and /base_polygon topic. You should then see a new polygon representing the chassis on the screen.
Tip
You can also add a topic directly by going to the "By topic" tab after clicking "Add".
Different RViz displays are designed to visualize different types of topics.
Now that you get the idea of what RViz is you are welcome to further explore other display types before moving on to creating customized visualizations in the 3D display.
You can explore the topics being published in the terminal. Try to use rostopic echo /base_polygon to see the content being published.
RViz with the real robot
RViz can similarly be used to visualize the current state of the real physical robot and its sensor data.
Note that you need to setup the ROS network configurations first. See m2_wiki::ros_master and network for more information.
Warning
Do not stream a point cloud from the real robot
This has caused problems in the past.
The robot has limited wireless network bandwidth and generally cannot stream point clouds across the network. When you work on perception in later labs, your code will run directly on the robot, where there are no bandwidth/latency issues.
Instead, you can stream an Image display, or you can look at the downsampled point cloud.
Moving the simulated chassis
The m2_fake_robot package also supports chassis simulation. To do this, run the sim_chassis.py node and run another launchfile:
rosrun m2_fake_robot sim_chassis.py
roslaunch m2_fake_robot tf.launch
The simulated chassis can move according to the cmd_vel topic. Try publishing a velocity to cmd_vel at 100hz and see the simulated robot move:
rostopic pub -r 100 /cmd_vel geometry_msgs/Twist "linear:
  x: 0.0
  y: 1.0
  z: 0.0
angular:
  x: 0.0
  y: 0.0
  z: 0.0"
Keyboard controller and historical odometry visualization
Alternatively, you can control the chassis using the keyboard. There is an omnidirectional keyboard controller provided in m2_chassis_utils. Try to clone this package and run the keyboard.py node.
Clone the m2_chassis_utils package if you havent:
cd ~/catkin_ws/src
git clone https://github.com/m2robocon/m2_chassis_utils.git
cd ~/catkin_ws
catkin_make
You may have to install blessed to make the node work. Use pip3 install blessed.
Run the render_map.py node:
rosrun m2_chassis_utils keyboard.py
Then you can use W+A+S+D to control the moving direction, and Q+E to rotate the robot.
Use Ctrl+Z to quit the keyboard node.
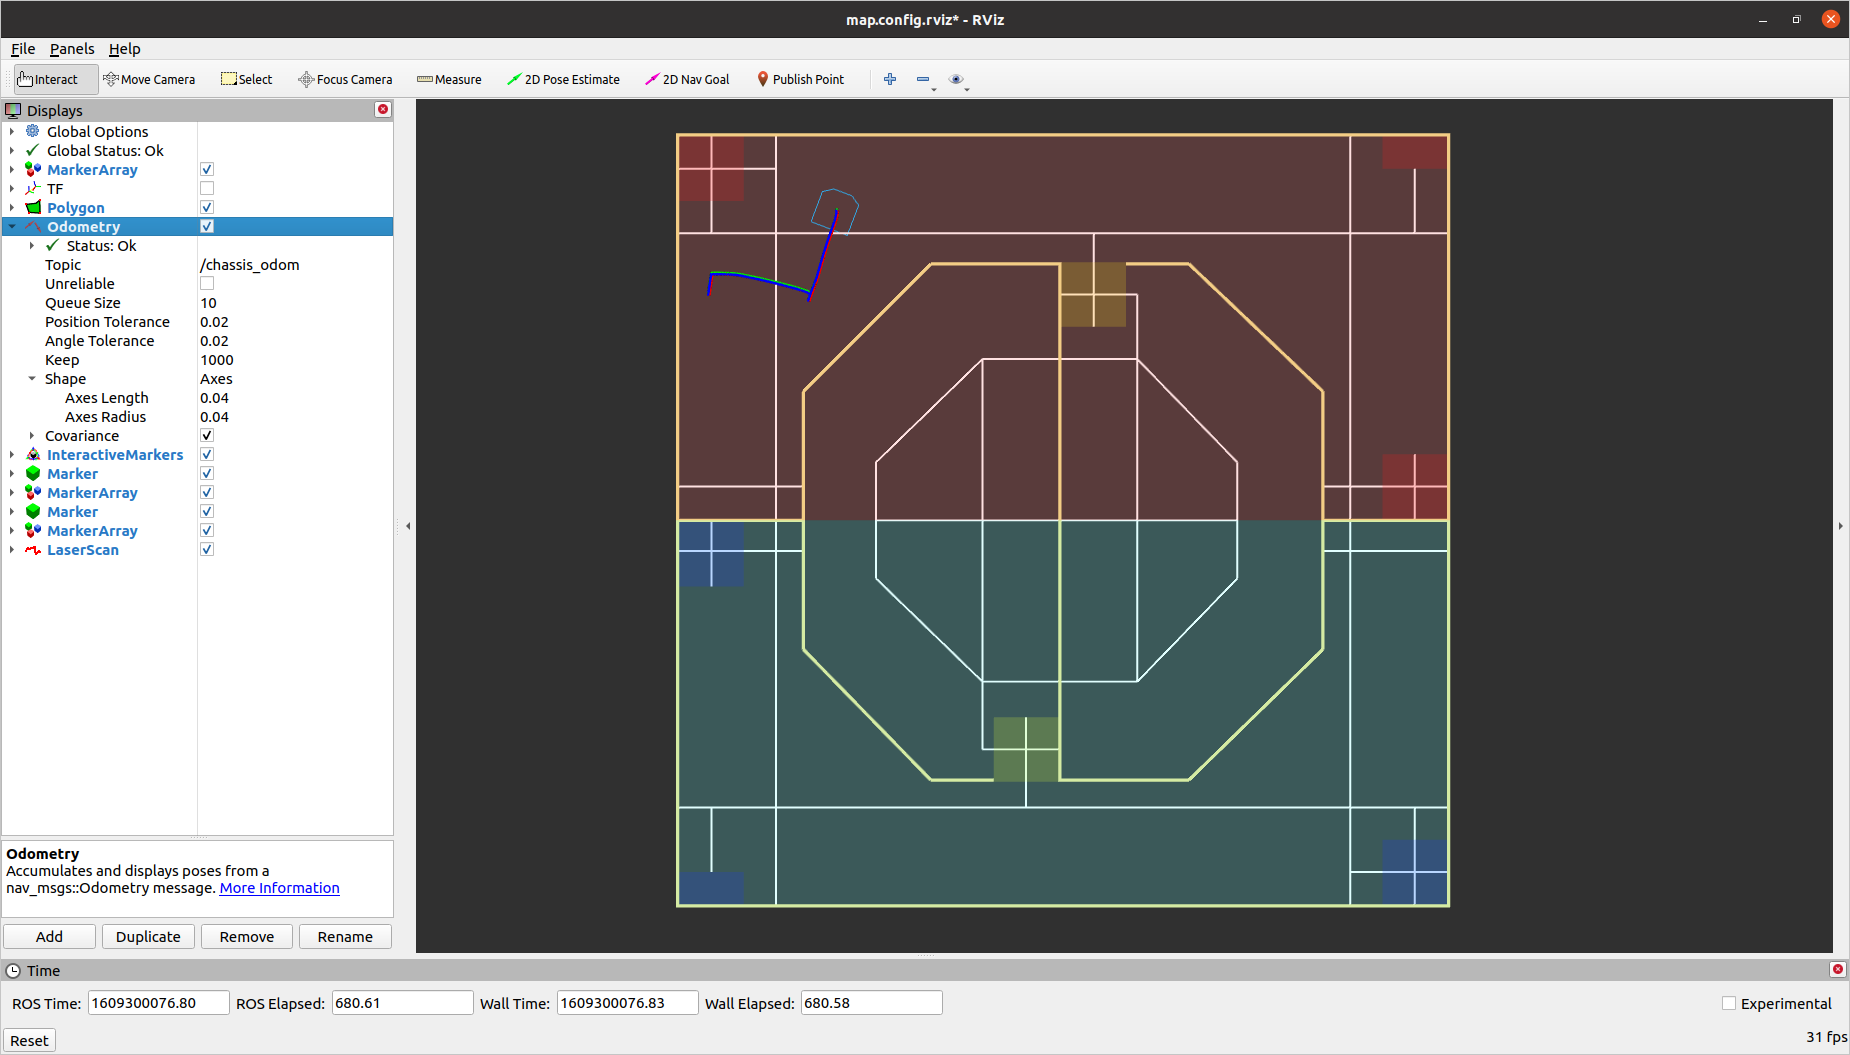
Now, in rviz, add the chassis_odom topic. Drive the robot in the keyboard node. You should see a path of the robot which indicates the previous odometry.
What is odometry?
Odometry represents an estimate of a position and velocity in free space.
See the official ros documentation on nav_msgs/Odometry.msg for more details.
To get a better idea of what is Odometry, you can try to view the published message contents using rostopic echo chassis_odom.
Saving and loading RViz configurations
You do not want to manually add all these displays every time you use RViz. Instead, you should save your current configuration.
To save your current configuration as the default (in ~/.rviz/default.rviz), just go to File->Save Config or press Ctrl+S.
Try saving and reloading RViz and make sure that your configuration comes up as expected.
Tip
Later, you will want different RViz configurations for different purposes.
You can save your current configuration to a separate .rviz file and switch between different configurations.
- To do so, go to
File->Save Config As. Your config file will be saved in~/.rviz/myconfig.rviz. Later, you can load this config file by going toFile->Open Config.
You also may want to run RViz with a certain config from the command line or from a launch file.
-
To open RViz with a particular config file, run:
rosrun rviz rviz -d ~/.rviz/myconfig.rviz -
To open RViz from a launch file with a particular config file, add this to your launch file:
<node pkg="rviz" type="rviz" name="$(anon rviz)" args="-d $(env HOME)/.rviz/myconfig.rviz" />
Try saving and loading a custom RViz config now.
Example
m2_fake_robot comes with its own rviz configuration file. Try to explore m2_fake_robot/all.launch. Kill the render_map.py and sim_chassis.py nodes,
Creating Custom Visualizations in RViz using Markers
Let's create custom visualizations in the RViz 3D display.
This is done with the help of Markers, which are a special type of 3D display you might have noticed in the previous part.
The Markers display allows programmatic addition of various primitive shapes to the RViz 3D view by sending a visualization_msgs/Marker or visualization_msgs/MarkerArray message.
The documentation of Markers is very important when filling out a marker message!
Add a marker display to RViz
Add a "Marker" display to RViz.
Note that it subscribes to the /visualization_marker topic by default.
Example
Let's create a new demo file for publishing markers in m2_fake_robot/src/marker_demo.py.
You should know how to create executable Python nodes on your own by now. Here is a basic outline of what you need:
#!/usr/bin/env python

import rospy

def wait_for_time():
    """Wait for simulated time to begin.
    """
    while rospy.Time().now().to_sec() == 0:
        pass

def main():
    rospy.init_node('my_node')
    wait_for_time()

if __name__ == '__main__':
    main()
Here is what you will need to import into your script:
from visualization_msgs.msg import Marker
from geometry_msgs.msg import Quaternion, Pose, Point, Vector3
from std_msgs.msg import Header, ColorRGBA
Next you will need to create a publisher for Marker type messages in your main function, before going into the infinite loop.
marker_publisher = rospy.Publisher('visualization_marker', Marker)
Before moving on, it would be a good idea to check what the Marker message involves using some of the ROS command line tools that you know very well by now.
Here is a function you can add to your script for publishing a Marker of type Marker.TEXT_VIEW_FACING which will include the text argument passed to the function.
def show_text_in_rviz(marker_publisher, text):
    marker = Marker(
                type=Marker.TEXT_VIEW_FACING,
                id=0,
                lifetime=rospy.Duration(1.5),
                pose=Pose(Point(0.5, 0.5, 1.45), Quaternion(0, 0, 0, 1)),
                scale=Vector3(0.6, 0.6, 0.6),
                header=Header(frame_id='omni_base'),
                color=ColorRGBA(0.0, 1.0, 0.0, 0.8),
                text=text)
    marker_publisher.publish(marker)
Notice that when you call this function from your main function, the marker does not show up in RViz.
- One way to debug whether this is an issue with our ROS code or with the visualization itself is to see if the message gets published.
- To do this, run
rostopic echo /visualization_markerand try running your script again. - You should observe that no messages are published on this topic, even though your code does publish to this topic!
The reason for this is that after you advertise a publisher in your code, you need to wait a little bit for the ROS master to notify other nodes and for those nodes to start subscribing to you.
All of this happens in the background, so you should just wait for a half second or so:
marker_publisher = rospy.Publisher('visualization_marker', Marker, queue_size=5)
rospy.sleep(0.5)
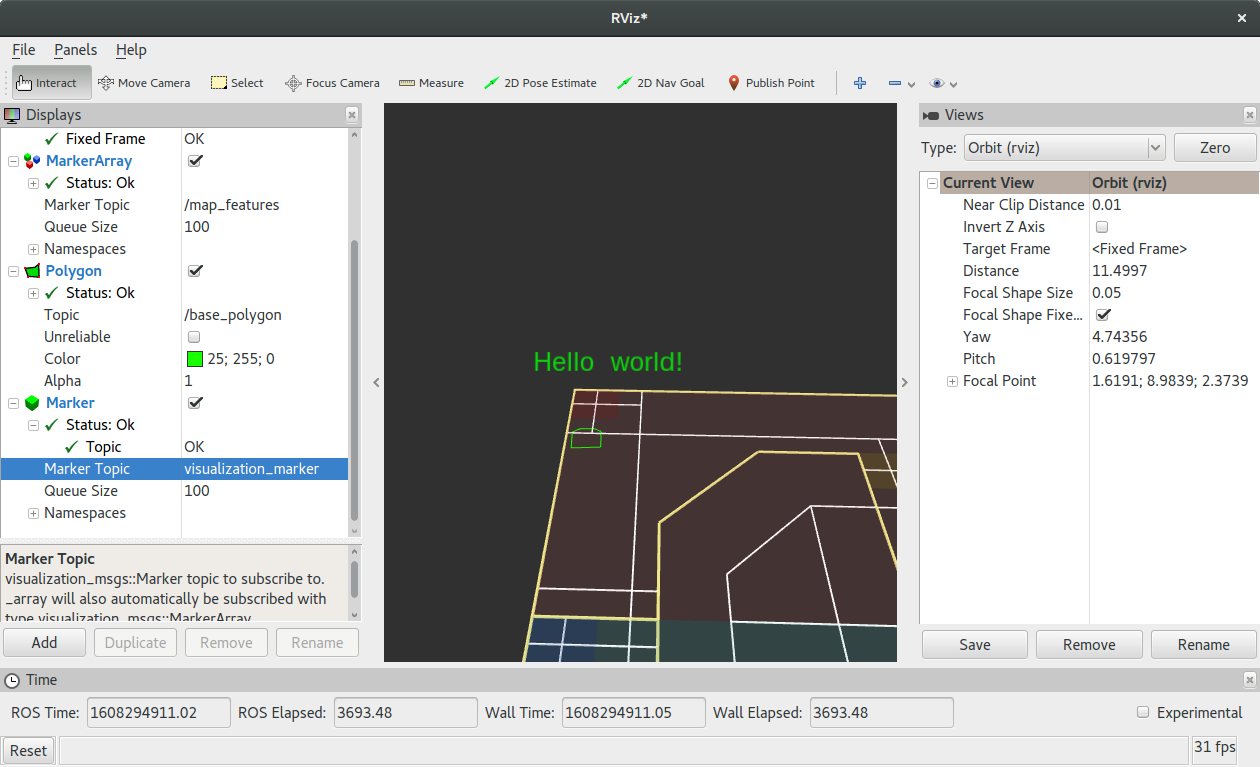
show_text_in_rviz(marker_publisher, 'Hello world!')
Now run the script, and you should see some green text appear in front of the robot and disappear 1.5 seconds later.
Next, try modifying the different parameters of the Marker message, re-run the script, and observe the effects on the visualization.
Try to change the following:
- The color
- The size of the text
- The location of the text
- The lifetime before the text disappears (including an infinite lifetime)
Note: rviz/DisplayTypes/Marker is the best reference for how to fill out a marker message.
Note that some fields are shared between all types of markers, while other fields are used in different ways depending on the marker type.
Tip
Recall that we needed to launch tf.launch when rendering the chassis.
This is because the omni_base frame and map frame are originally dependent. We need to use a ROS library called tf2 to link them together.
Try it yourself: Visualizing the robot path with Markers
Next, create a script to publish a Marker that visualizes the path taken by the robot.
To do that you will need to know where the robot is at any given time.
To that end, use ROS command line tools to explore the data in the /chassis_odom topics.
You will need to extend your script to subscribe to these messages and update parameters of the path visualization based on the messages received on this topic.
To visualize the path you can use Marker.LINE_STRIP or Marker.SPHERE_LIST type markers.
Rather than adding points to the path with a constant frequency, try adding points only when the robot is displaced by a certain amount from its previous pose.
When you are done modifying your script, you should be able to move the robot around with the the keyboard teleoperation and observe the trace that it leaves behind.
Hints:
- You can get the current location of the robot from the
/chassis_odomtopic. - You will need to keep track of where you last rendered a point on your path. If you are using the
LINE_STRIPmarker, then you will want to keep around a list of points that the robot has visited. Either way, you will need to store some state and use it with your subscriber callback. The best way to do this is with a class. You can make a subscriber call a class method as follows:
class NavPath(object):
    def __init__(self):
        self._path = []

    def callback(self, msg):
        rospy.loginfo(msg)
        if SOME_CONDITION:
            self._path.append(msg.foo.bar)

def main():
    # ...setup stuff...
    nav_path = NavPath()
    rospy.Subscriber('chassis_odom', Odometry, nav_path.callback)
    rospy.spin()
Note that you need to add rospy.spin() to the end of your main function because this node needs to run forever to monitor the /chassis_odom topic.
An example using the SPHERE_LIST marker type:

An example using the LINE_STRIP marker type:
